by Devin Yang
(This article was automatically translated.)

Published - 1 year ago ( Updated - 1 year ago )

CPU data
Check the CPU, check the model name and the number of cpus (several cores)

cat /proc/cpuinfo |grep 'model name'|tail -n1
cat /proc/cpuinfo |grep 'model name'|wc -l

Operation screen

# cat /proc/cpuinfo |grep 'model name'|tail -n1
model name	: Intel(R) Xeon(R) Silver 4214 CPU @ 2.20GHz
# cat /proc/cpuinfo |grep 'model name'|wc -l
24

If there is an lscpu command, it is desirable to update the clear information

lscpu
Architecture:                    x86_64
CPU op-mode(s):                  32-bit, 64-bit
Byte Order:                      Little Endian
Address sizes:                   46 bits physical, 48 bits virtual
CPU(s):                          24
On-line CPU(s) list:             0-23
Thread(s) per core:              2
Core(s) per socket:              12
Socket(s):                       1
NUMA node(s):                    1
Vendor ID:                       GenuineIntel
CPU family:                      6
Model:                           85
Model name:                      Intel(R) Xeon(R) Silver 4214 CPU @ 2.20GHz
Stepping:                        7
底下....略.....

Memory
check how much memory

grep MemTotal /proc/meminfo
egrep 'MemTotal|MemFree|MemAvailable' /proc/meminfo

Actual operation screen

$ egrep 'MemTotal|MemFree|MemAvailable' /proc/meminfo
MemTotal:       82024272 kB
MemFree:        51008940 kB
MemAvailable:   74909208 kB

If there is a free command, the following command can be used to make it clearer

$free -h
               total        used        free      shared  buff/cache   available
Mem:            78Gi       4.1Gi        48Gi       1.8Gi        25Gi        71Gi
Swap:          8.0Gi          0B       8.0Gi


hard disk space
The disk can be detected with the df command

df -h
Filesystem                         Size  Used Avail Use% Mounted on
tmpfs                              7.9G  6.6M  7.9G   1% /run
/dev/mapper/ubuntu--vg-ubuntu--lv   98G   35G   58G  38% /
tmpfs                               40G     0   40G   0% /dev/shm
tmpfs                              5.0M     0  5.0M   0% /run/lock
/dev/sda2                          2.0G  248M  1.6G  14% /boot
/dev/sda1                          1.1G  5.3M  1.1G   1% /boot/efi
tmpfs                              7.9G  4.0K  7.9G   1% /run/user/0
tmpfs                              7.9G  4.0K  7.9G   1% /run/user/1000

If you want a beautiful picture, we can also use neofetch to quickly check, usually need to be installed separately.
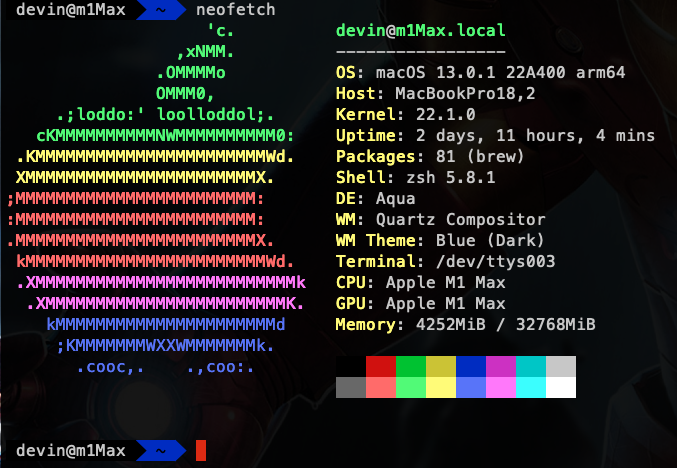
E.g:
Manjaro Linux will look like this
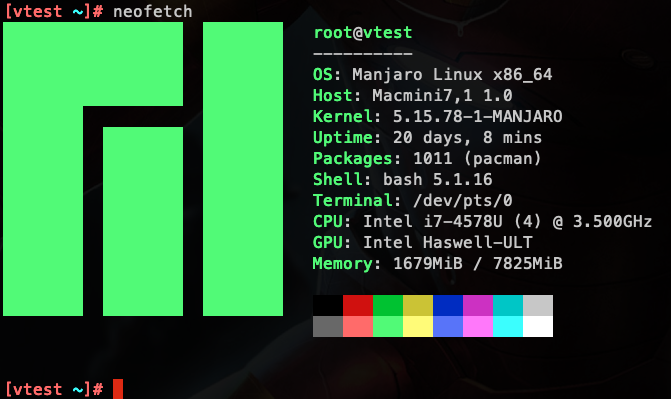
Tags: bash cli

Devin Yang

Feel free to ask me, if you don't get it.:)

No Comment

Post your comment

Login is required to leave comments

Similar Stories


linux, cli

How to use the find command to find files that have been changed within 7 days

If we have changed some files, how to find out through the command line?

Synology,cli

Change the password of my Synology NAS via the command line

Adjust password by command line synouser --setpw admin <yourpassword>

ansible,bash

My first ansible, automated database transfer

In this article, I use Docker on MacOS to share my experience in using Ansible. You can adjust it to your desired Ansible environment according to this directory structure, or learn Ansible. The situation is like this, I hope that in my test environment, I can see articles that are the closest to the official machine, but I don't want to use the test machine program to directly connect to the database of the official machine. My manual method is to export the db of the official machine, copy it to the test machine and then import it. Although there are not a few steps, it seems to be a bit annoying to do, and manual operation is easy to make mistakes. This reminds me of Ansible. I've heard of it but haven't tried it, so why not give it a try.